Tag
NASA
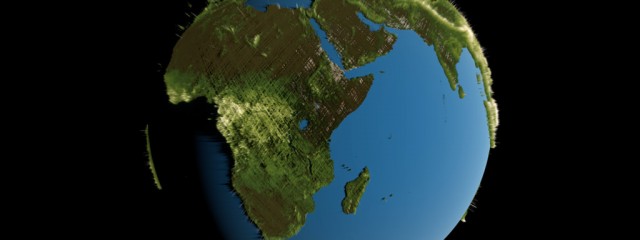
Visualizing GEDI Forest Height Data
The Global Ecosystem Dynamics Investigation (GEDI) produces high resolution laser ranging observations of the 3D structure of the Earth. GEDI’s precise measurements of forest canopy height, canopy vertical structure, and surface elevation greatly advance our ability to characterize important carbon and water cycling processes, biodiversity, and habitat. This visualization depicts a global view of forest height data c
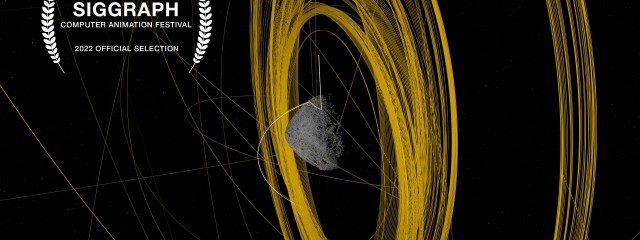
Read MoreA Web Around Asteroid Bennu
Official Selection – 2022 SIGGRAPH Computer Animation Festival 101955 Bennu is one of Earth’s closest planetary neighbors – an asteroid roughly the height of a skyscraper, and since late 2018, the place that NASA’s OSIRIS-REx mission has called home. When OSIRIS-REx arrived on December 3, 2018, it began wrapping Bennu in a complex web of observations. OSIRIS-REx departed Bennu on May 10, 2021 on a return voyage
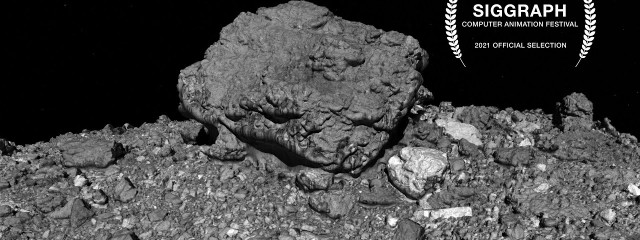
Read MoreTour of Asteroid Bennu
Official Selection – 2021 SIGGRAPH Computer Animation Festival When NASA’s OSIRIS-REx spacecraft arrived at asteroid Bennu in December 2018, its close-up images confirmed what mission planners had predicted nearly two decades before: Bennu is made of loose material weakly clumped together by gravity, and shaped like a spinning top. This major validation, however, was accompanied by a major surprise. Scientists had ex
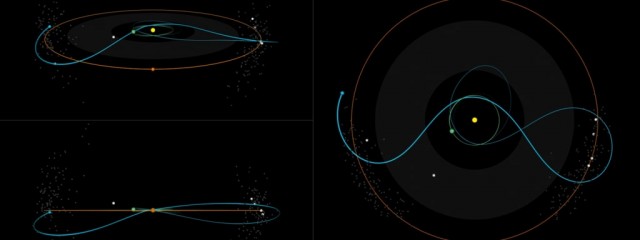
Read MoreLucy mission trajectory
Jupiter’s swarms of Trojan asteroids may be remnants of the primordial material that formed the outer planets, and serve as time capsules from the birth of our Solar System more than 4 billion years ago. The Trojans orbit in two loose groups that orbit the Sun, with one group always ahead of Jupiter in its path, the other always behind. At these two Lagrange points the bodies are stabilized by the Sun and Jupit
Read MoreKepler’s Laws of Planetary Motion Described Using Earth Satellites
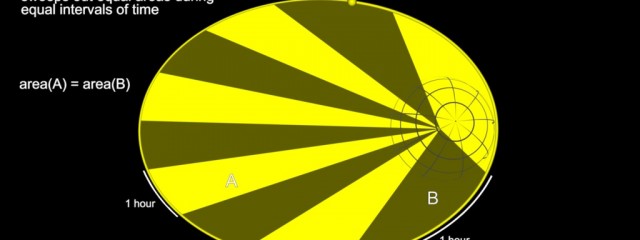
This visualization introduces Kepler’s three laws of planetary motion using satellites in orbit around Earth. Several satellite orbits of varying characteristics are examined to see how Kepler’s laws apply. Johannes Kepler was born on December 27, 1571, in Weil der Stadt, Württemberg, in the Holy Roman Empire of German Nationality. Kepler moved to Prague to work with the renowned Danish astronomer, Tycho Brahe. He in
Read MoreDate: 12 May 2016
Comment: Comments are off
Calbuco Volcano Eruption
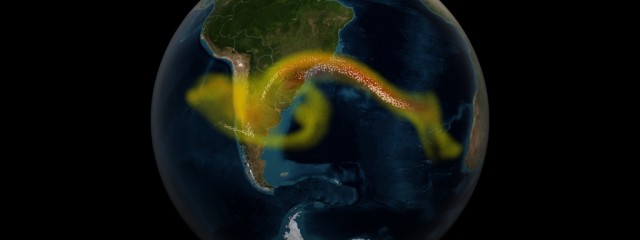
Visualization of results from a supercomputer model of ash and sulfur dioxide spreading from an eruption of the Calbuco volcano in April 2015. The supercomputer combines the physics and chemistry of the atmosphere with data from the NASA/NOAA/DoD Suomi NPP satellite to model the full three-dimensional structure of the volcanic cloud. Model data is compared to observation data collected from the NPP satellite. Data wa
Read MoreJPSS Multi Mission Concept of Operations
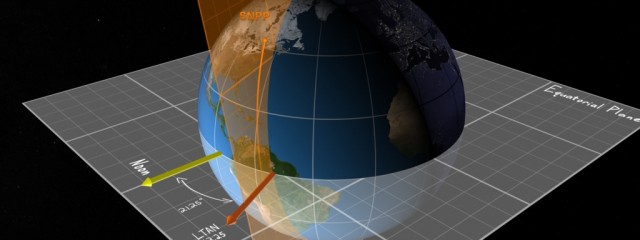
This visualization explains the key concepts (i.e. orbit, observation, communication, and constellation) of the NASA/NOAA Joint Polar Satellite System (JPSS) Mission. This visualization was used during a NASA mission readiness review for the JPSS constellation mission.
Read MoreDate: 01 Oct 2015
Comment: 0
CATS/CPL Underflight
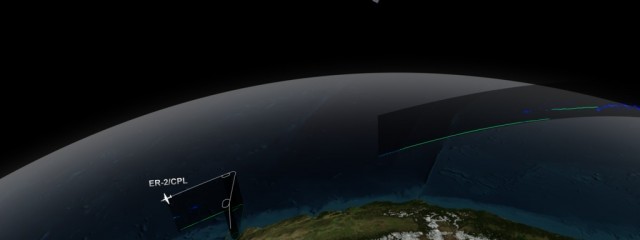
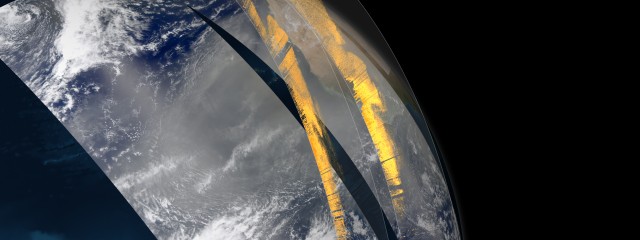
NASA’s Cloud-Aerosol Transport System, or CATS, is a lidar remote-sensing instrument taking measurements of atmospheric aerosols and clouds from the International Space Station (ISS). Launched to the ISS in January 2015, CATS is specifically intended to demonstrate a low-cost, streamlined approach to developing ISS science payloads. The CATS mission extends the data record of space-based aerosol and cloud measurement
Read MoreDate: 28 Feb 2015
Comment: 0
Visualizing Saharan dust crossing the Atlantic Ocean
Each year, dust from the Saharan Desert in Africa is swept up into the atmosphere, where it travels across the Atlantic Ocean towards the Amazon Rainforest in South America. On average, 27 million tons of African dust is deposited into the Amazon Basin each year. So much dust is deposited in the Amazon each year that scientists credit the phosphates found in that dust with fertilizing the Amazon Rainforest and keepi
Read MoreDate: 28 Feb 2015
Comment: 0
GPM Storm Visualizations
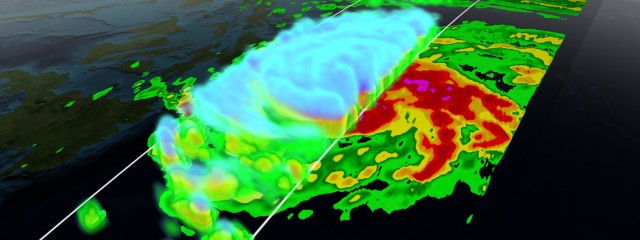
These visualizations were creating using data from NASA’s Global Precipitation Measurement (GPM) satellite. The visualization pipeline was developed at NASA’s Scientific Visualization Studio. Each of these ‘quick-turn’ visualizations were created in a day or two in order to publish within the storm’s news cycle. Data is processed in IDL, modeled in Maya, and rendered using Renderman. S
Read More12
© 2012 Kel Elkins. All Rights Reserved.

