
Visualizing Saharan dust crossing the Atlantic Ocean
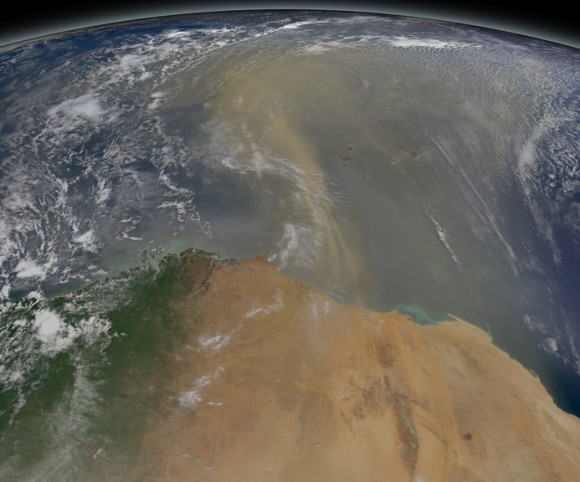
Each year, dust from the Saharan Desert in Africa is swept up into the atmosphere, where it travels across the Atlantic Ocean towards the Amazon Rainforest in South America. On average, 27 million tons of African dust is deposited into the Amazon Basin each year. So much dust is deposited in the Amazon each year that scientists credit the phosphates found in that dust with fertilizing the Amazon Rainforest and keeping it as lush as it is.
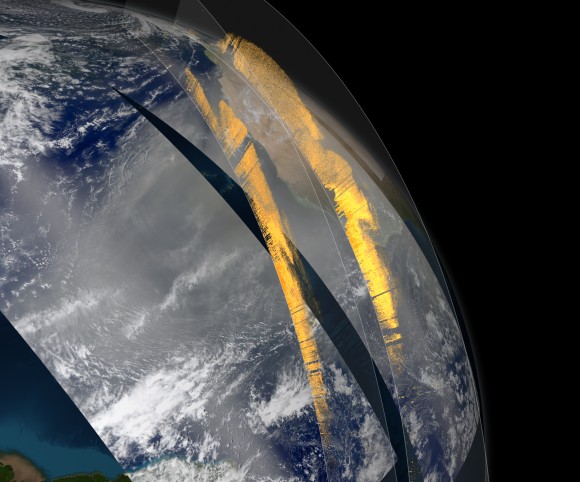
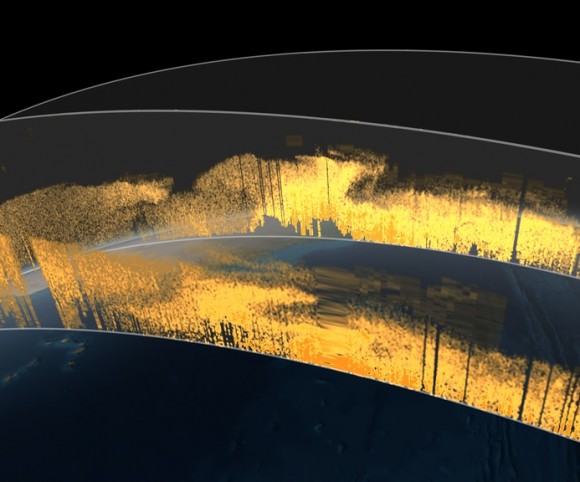
These visualizations were created to tell the story of African Dust. The textures on the vertical walls were created using data from NASA’s CALIPSO satellite, which measures aerosols in the atmosphere. These walls are compared with the satellite imagery taken from the same time period. The hazy brown sections of the images are where dust is present in the atmosphere. Viewing the CALIPSO data walls sequentially allows us to follow the dust as it travels across the ocean and makes it’s way toward South America.
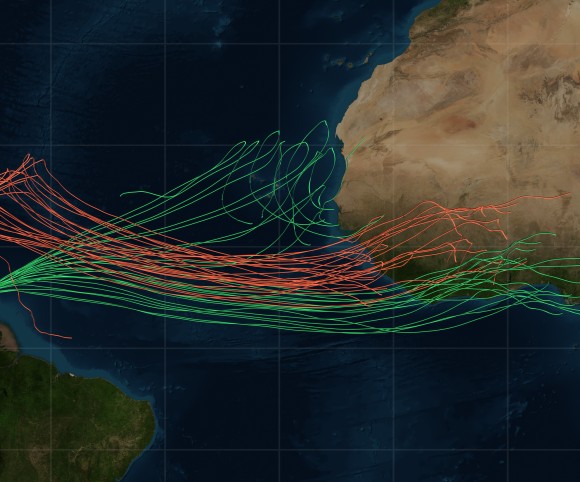
The second half of the visualization below describes dust flux – or how much dust moves through a region over a period of time. The amount of dust in the atmosphere varies with season, and has a lot to do with how much rain Africa gets. Flux is visualized using a particle system that emits particles at a rate and velocity relative to the measured flux for a region, and we can see how those particle shapes evolve over the seasons.
Full video:
CALIPSO data walls closeup:
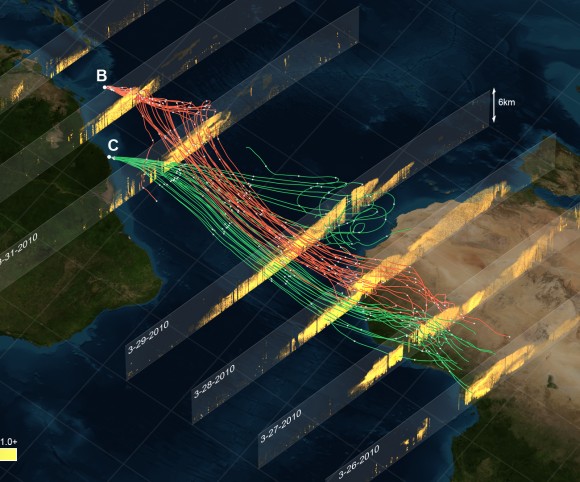
Comparing CALIPSO data walls with backwards-propagated dust routes:
These visualizations were used in a longer narrated piece produced by NASA’s Goddard Media Studios. The story was well received by the media, with versions running on Discovery, Time, the Washington Post, and Weather.com.
For more on this story, check out NASA’s SVS website