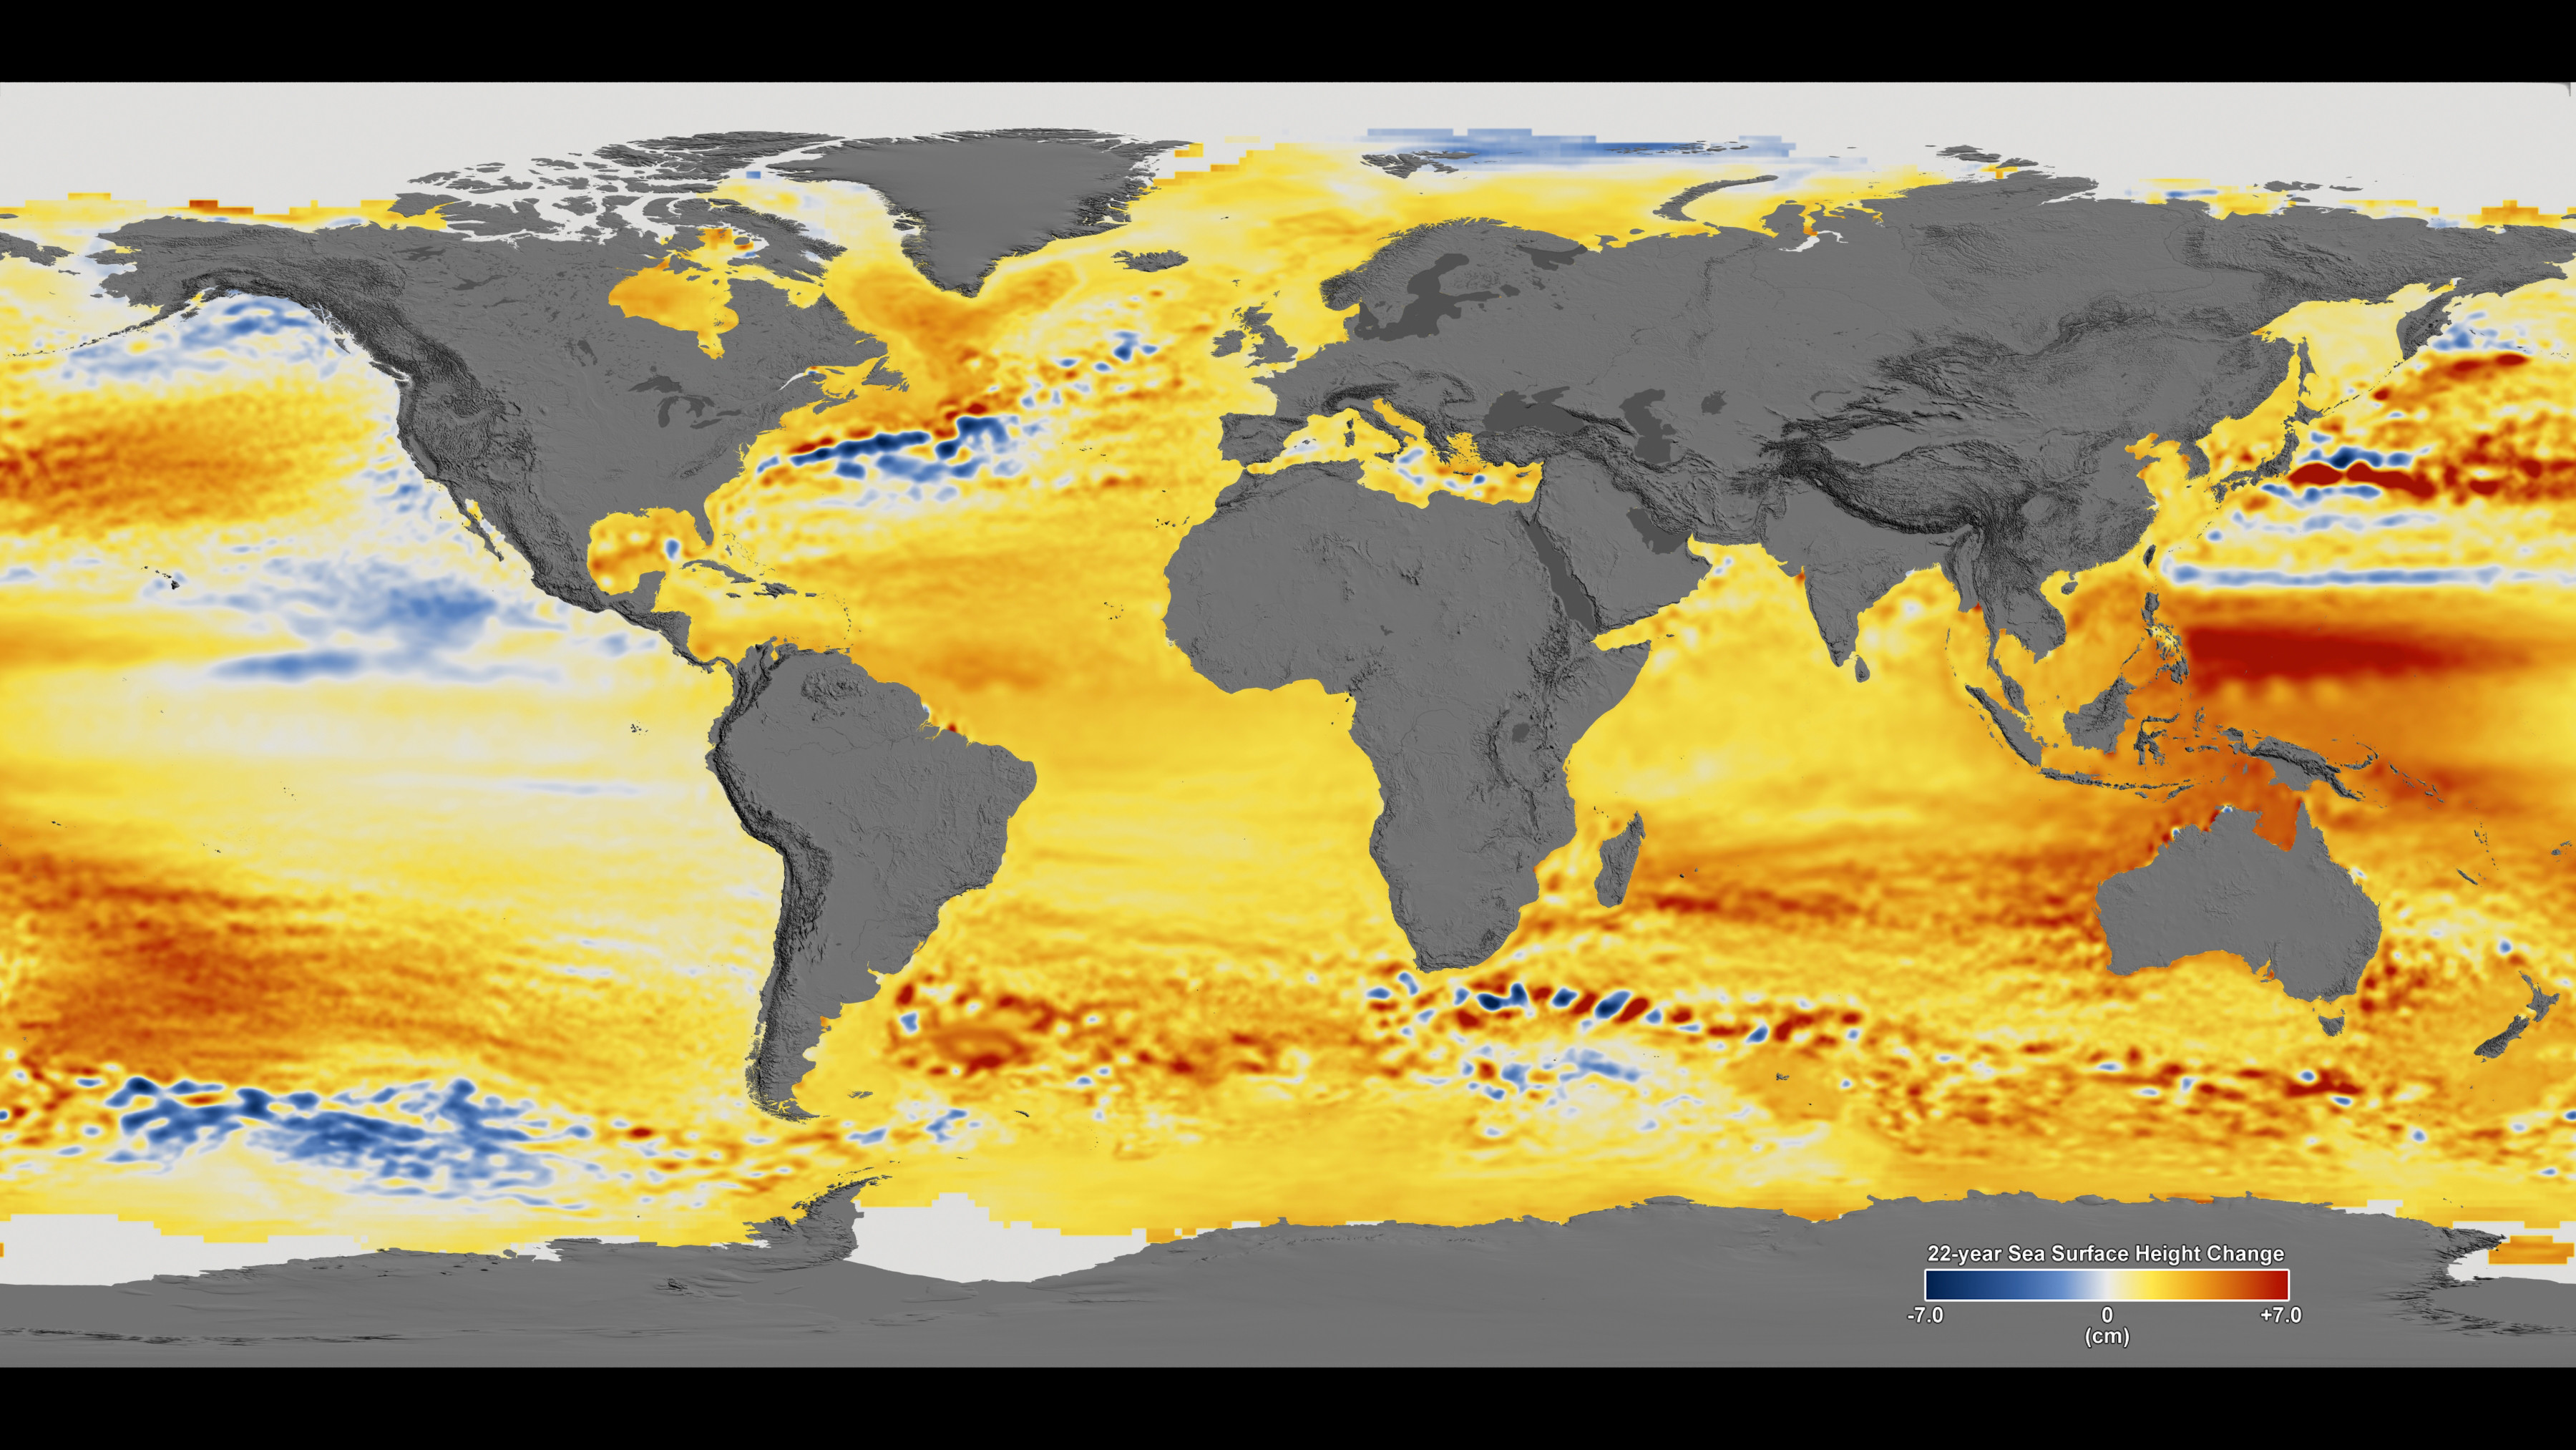
22-year Sea Level Rise
This visualization shows total sea level change between 1992 and 2014, based on data collected from the TOPEX/Poseidon, Jason-1, and Jason-2 satellites. Blue regions are where sea level has gone down, and orange/red regions are where sea level has gone up. Since 1992, seas around the world have risen an average of nearly 3 inches. This visualization was used as part of NASA’s presence at the 2015 United Nations Climate Change Conference in Paris, France.
The color range for this visualization is -7 cm to +7 cm (-2.76 inches to +2.76 inches), though measured data extends above and below 7cm(2.76 inches). This particular range was chosen to highlight variations in sea level change.
Data was processed in IDL, modeled in Maya, and rendered in Renderman.