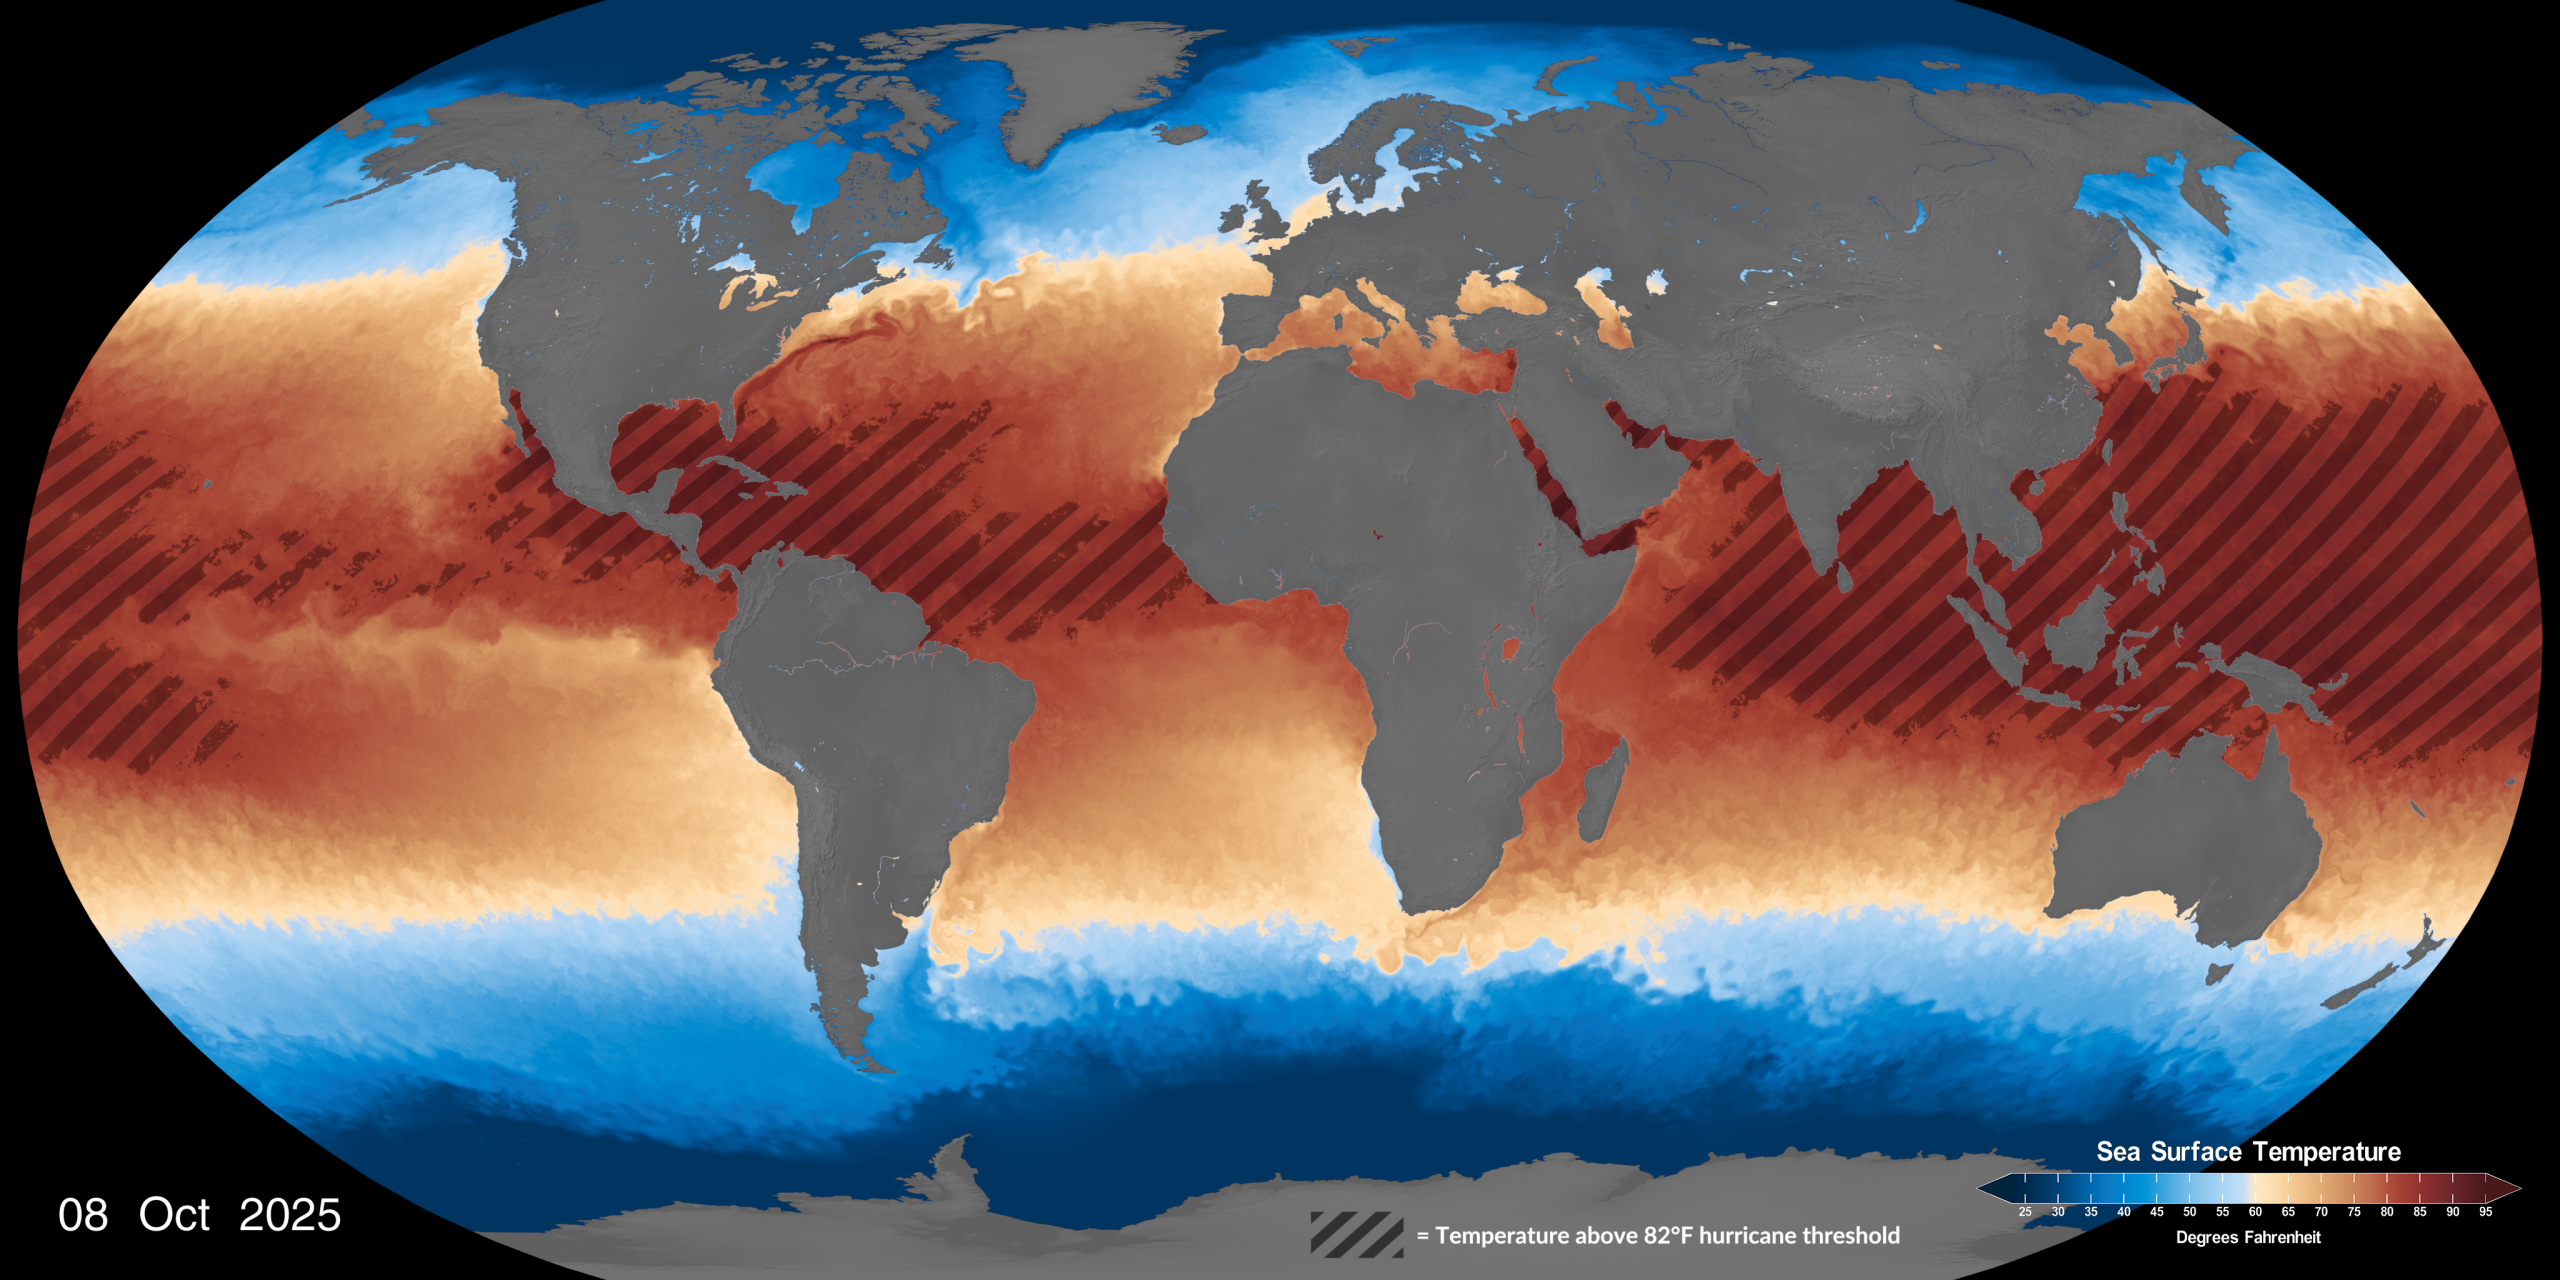
This automated visualization shows global sea surface temperature using JPL’s MUR dataset, updated daily with the latest available data. It renders multiple map projections and includes an overlay highlighting ocean regions above 82°F, the threshold where warm waters can intensify tropical storms and hurricanes.
The visualization runs as part of an auto-updating pipeline managed by custom control software I developed for the NASA Earth Information Center. This system handles scheduling, execution, error checking, and logging for all automated visualizations, enabling real-time content updates for public displays at NASA Headquarters, the Smithsonian National Museum of Natural History, and the Kennedy Space Center.
You can view the latest animated version of this visualization at: https://svs.gsfc.nasa.gov/5101/