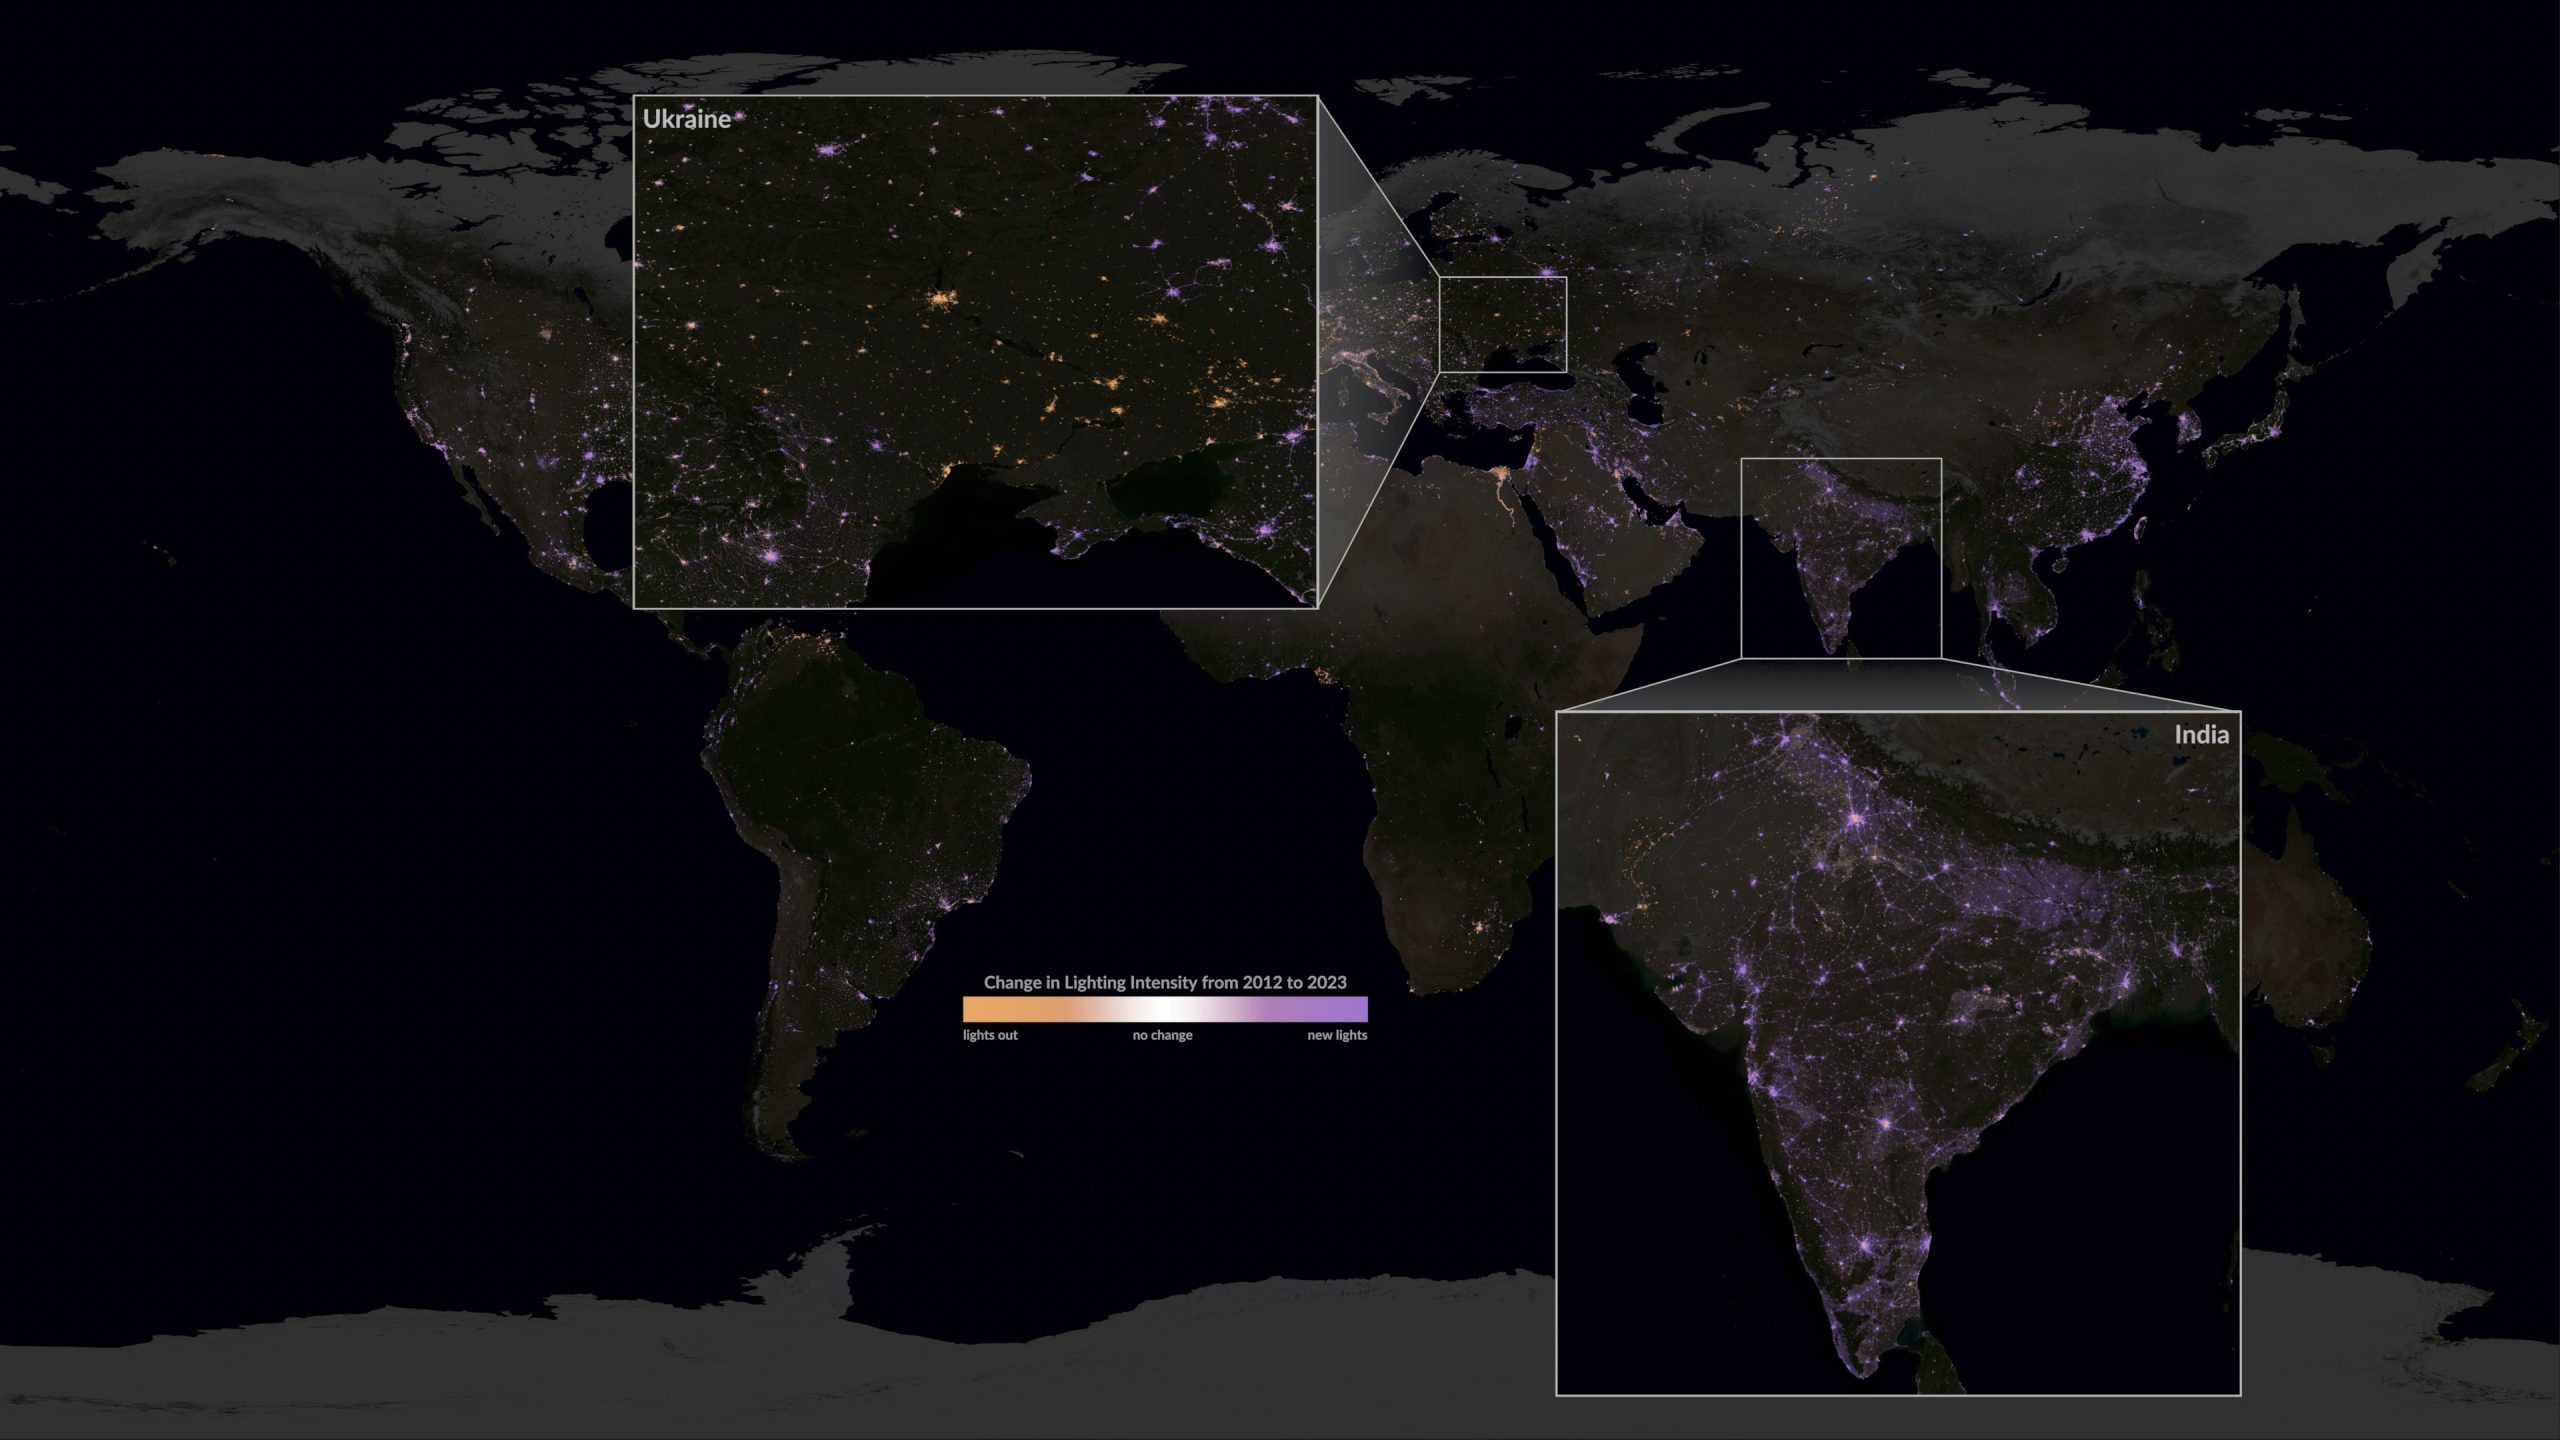
This global, flat map view of night lights data begins with a time series depicting annual averages from 2012 to 2023. The lights then fade away to reveal night lights change between 2012 and 2023, with regions of more light depicted in purple and regions with less light depicted in orange. The sequence then repeats with two pop-out, zoomed-in views of India and Ukraine.
See more here:https://svs.gsfc.nasa.gov/5276/